
2 months
WheelsEye is a fleet management platform in India offering telematics solutions like - GPS tracking, advanced Pro features, diesel monitoring and many more. It serves logistics companies and large fleet owners seeking operational visibility, fuel control, and compliance management at scale - shifting manual operations to digital fleet intelligence.
For this project, i owned end to end design of the dashboard and the following:
Problem framing
Understanding user needs and current gaps
Stakeholder alignment (PM's + Business + Ops) along with my respective PM
PROJECT DESCRIPTION
A web-based fleet intelligence dashboard designed for large fleet owners managing 20 - 500+ vehicles. Wheelseye positions itself as a full-stack fleet operations platform, combining hardware (GPS, Diesel Sensor) with SaaS monitoring tools tailored to Indian fleet operators.
Its core differentiators:
Strong presence among mid-to-large fleet owners
Hardware + software ecosystem
Operational-first focus (trips, fuel, compliance)
THE PROBLEM & RESERACH
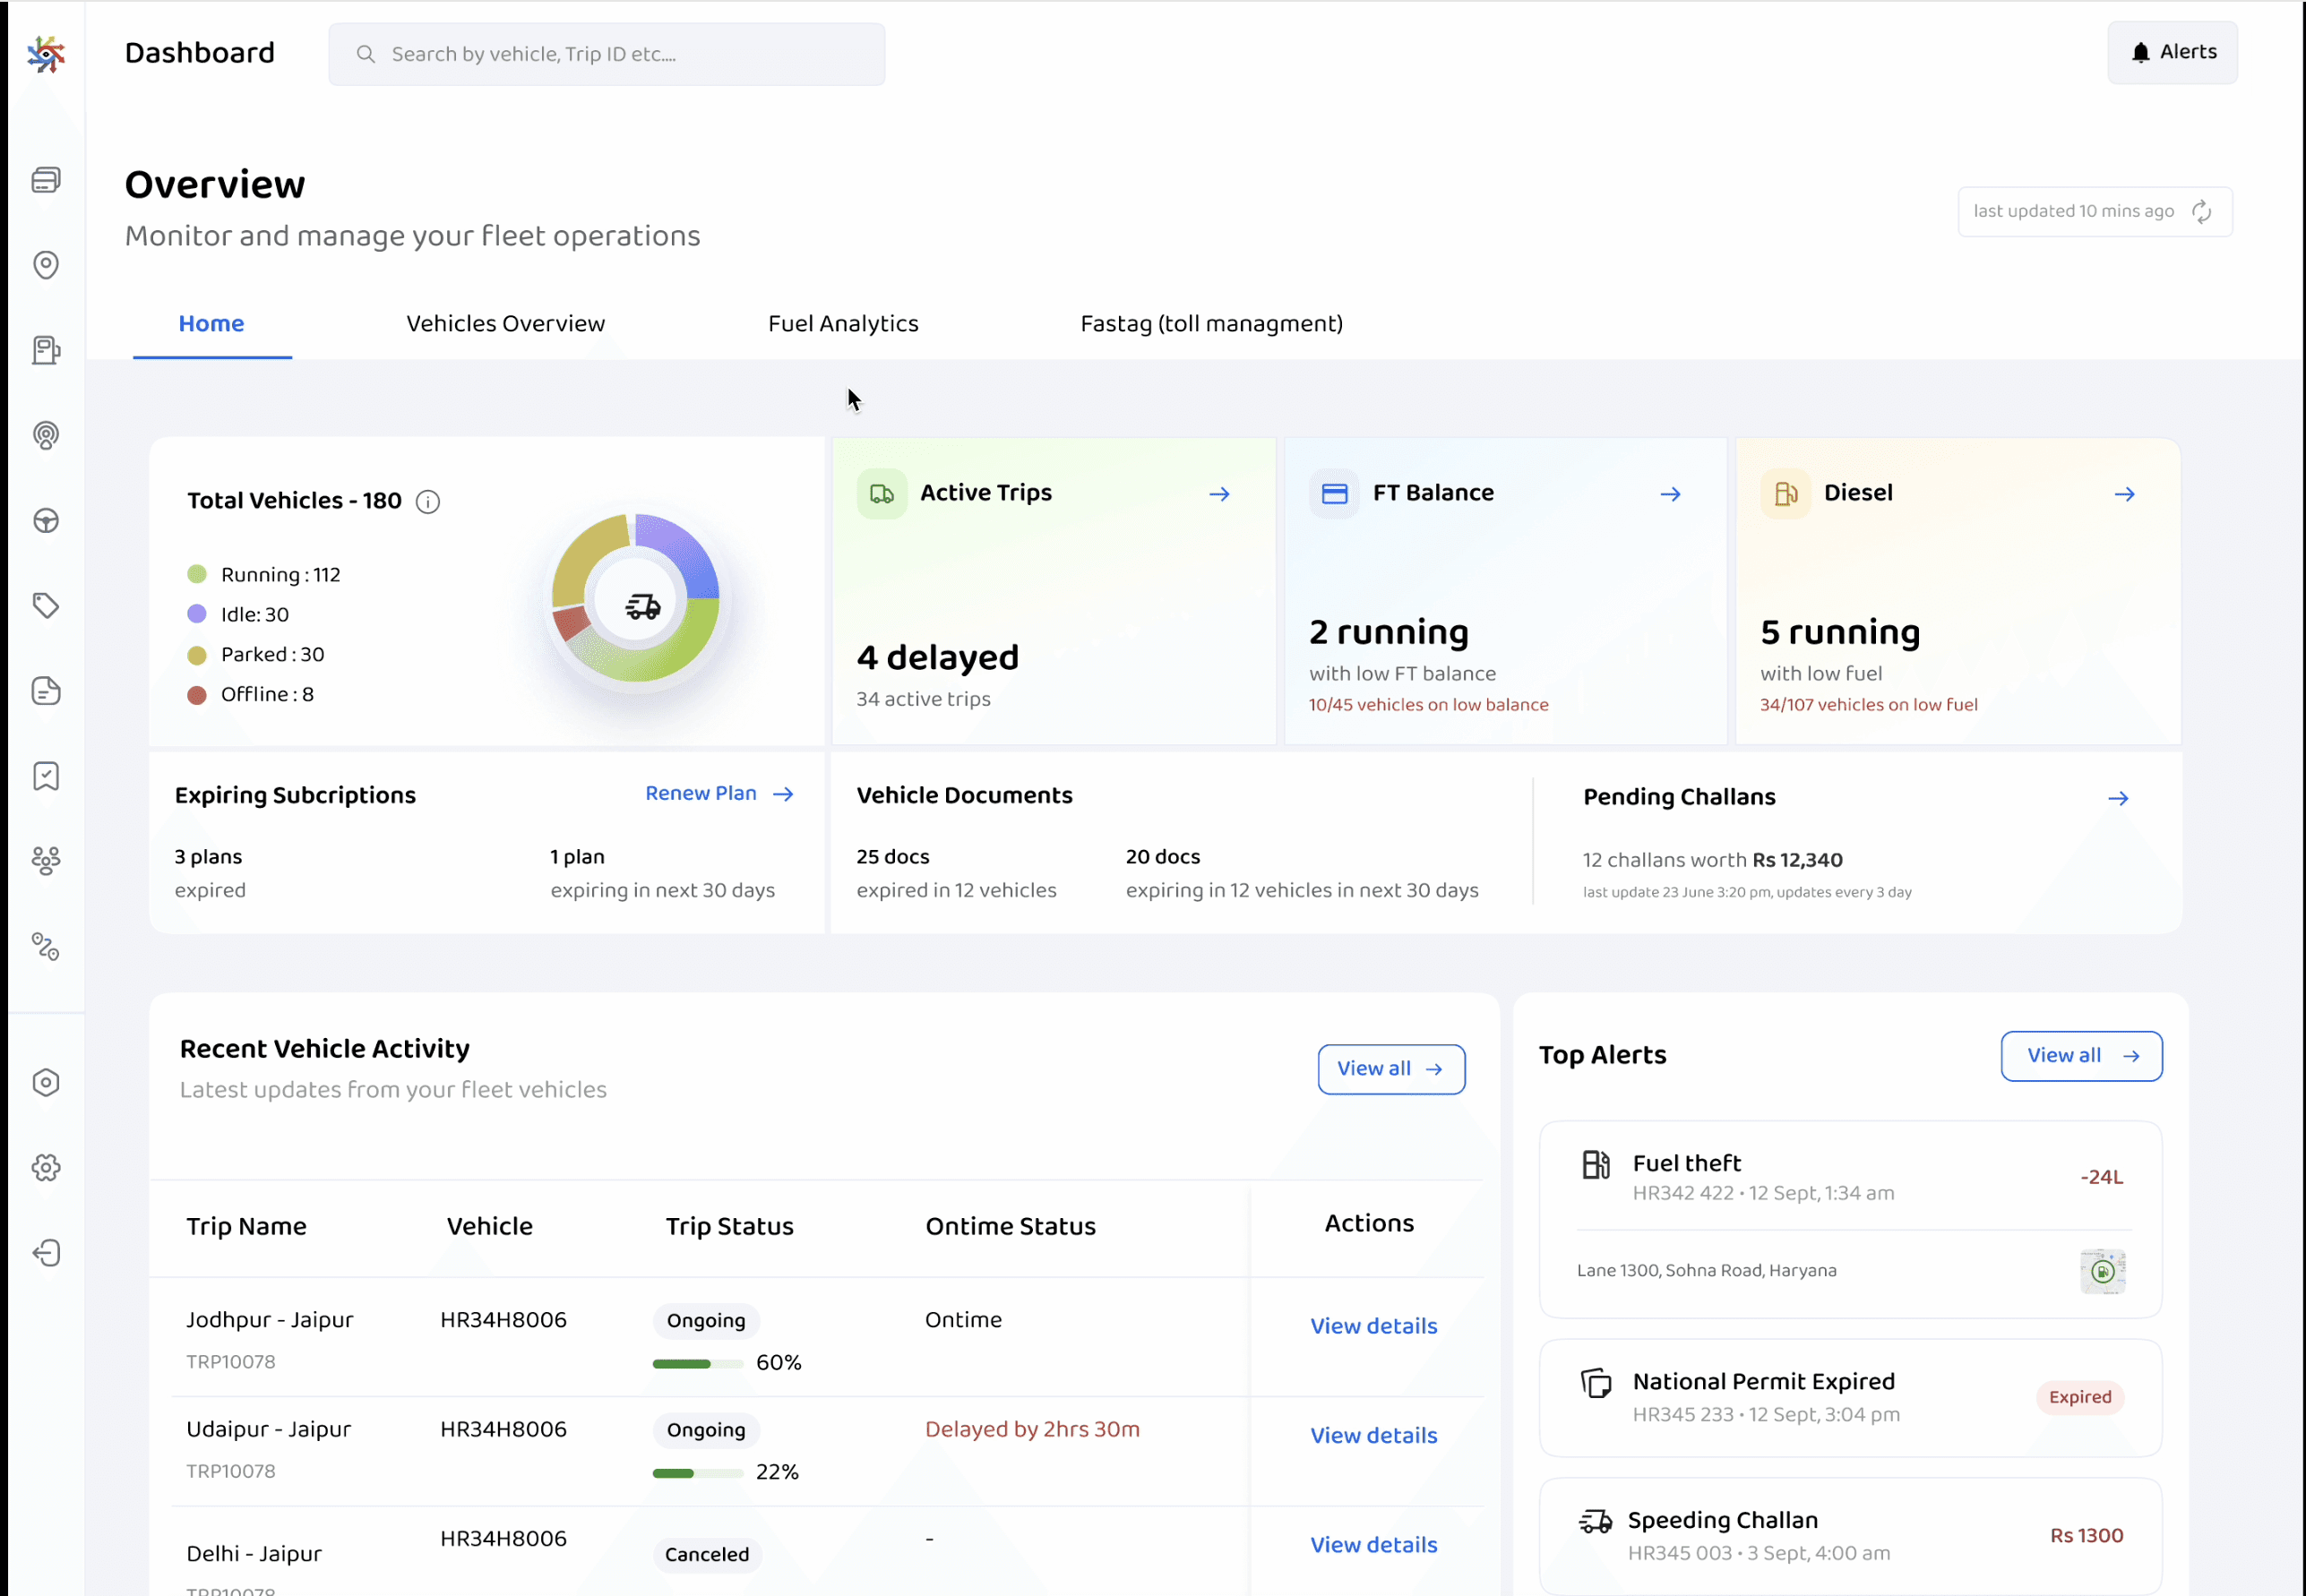
As Wheelseye started working with larger fleet owners, we understood that managing the fleet operations are more complex. Users had data across multiple products like GPS, Pro, and Diesel Sensor, but there was no single place to quickly understand what was going wrong. Fleet owners needed a simple way to track vehicle health, delays, fuel issues, and risks in one view. This dashboard was created to bring all important insights together and help users make faster operational decisions.
As fleets scaled, fleet owners lacked a single place to understand fleet performance and status. (individual modules were launched as per the need of user. it was now critical to stitch them together and provide the right insights at the right place)
Decisions were reactive, not data-driven - leading to missed opportunities and higher dependency on support team. Time-sensitive decisions required a scan, not a long wait.
Give user actionable data to make faster, better decisions.
Spot underutilization and inefficiencies at scale


FOR WHOM
Fleet Owner
Wants the big picture - total vehicles, fuel costs, compliance risk, and financial health at a glance. Checks in once a day, needs to spot anomalies fast.
Uses: mobile application more
Operations Manager
Lives in the tool daily - dispatching vehicles, tracking trip delays, reacting to alerts. Needs exception handling and quick actions, not just numbers.
Uses: mobile + web application
→ Customer Calling
→ Field Visits
→ Domestic & Global market research
→ Sales Team calls breakdown
→ Existing product data (MetaBase, reports)
Customer Calls
Connected with 20+ customers, primarily focusing on MFOs & LFOs.


Field Visit
Connected with 3 LFO customers(Bilaspur), each having 80+ vehicles on GPS/GPS Pro (using our services for the last 5+ years)


💬
What users says

Domestic & Global market research
Studied in which direction the key domestic players & Global leaders are heading to solve Tracking as a problem space.
Domestic - Tata FleetEdge, Blackbuck, Fleetx, Taabi(Ceat)
Global - GeoTab, Karooo
Most competitors optimized for visibility. We identified an opportunity around operational intelligence.

Most Used Features via Data
We took out data to understand the usage patterns used by our operators on the app. This further supported us to narrow down the features that we should use for the web overview and design a more insight driven dashboard.
Below were the most used features:

GOALS
Business Goals
📈Increase in engagement > leading more retention (increase in DAU/MAU)
📈Increase in Renewal rate as users see measurable operational value.
🌟Improvement in NPS through transparency and unified experience.
Target more Enterprise Owner
Design Goals
Make complex operational data easy to scan and act on
Enable faster decision-making with actionable insights
Design a modular dashboard scalable across products
DESIGN BREAKDOWN
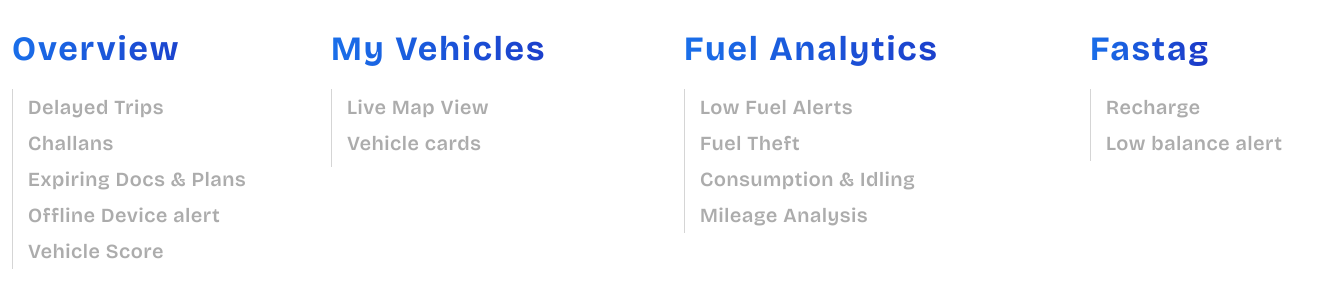
Information Architecture
scroll
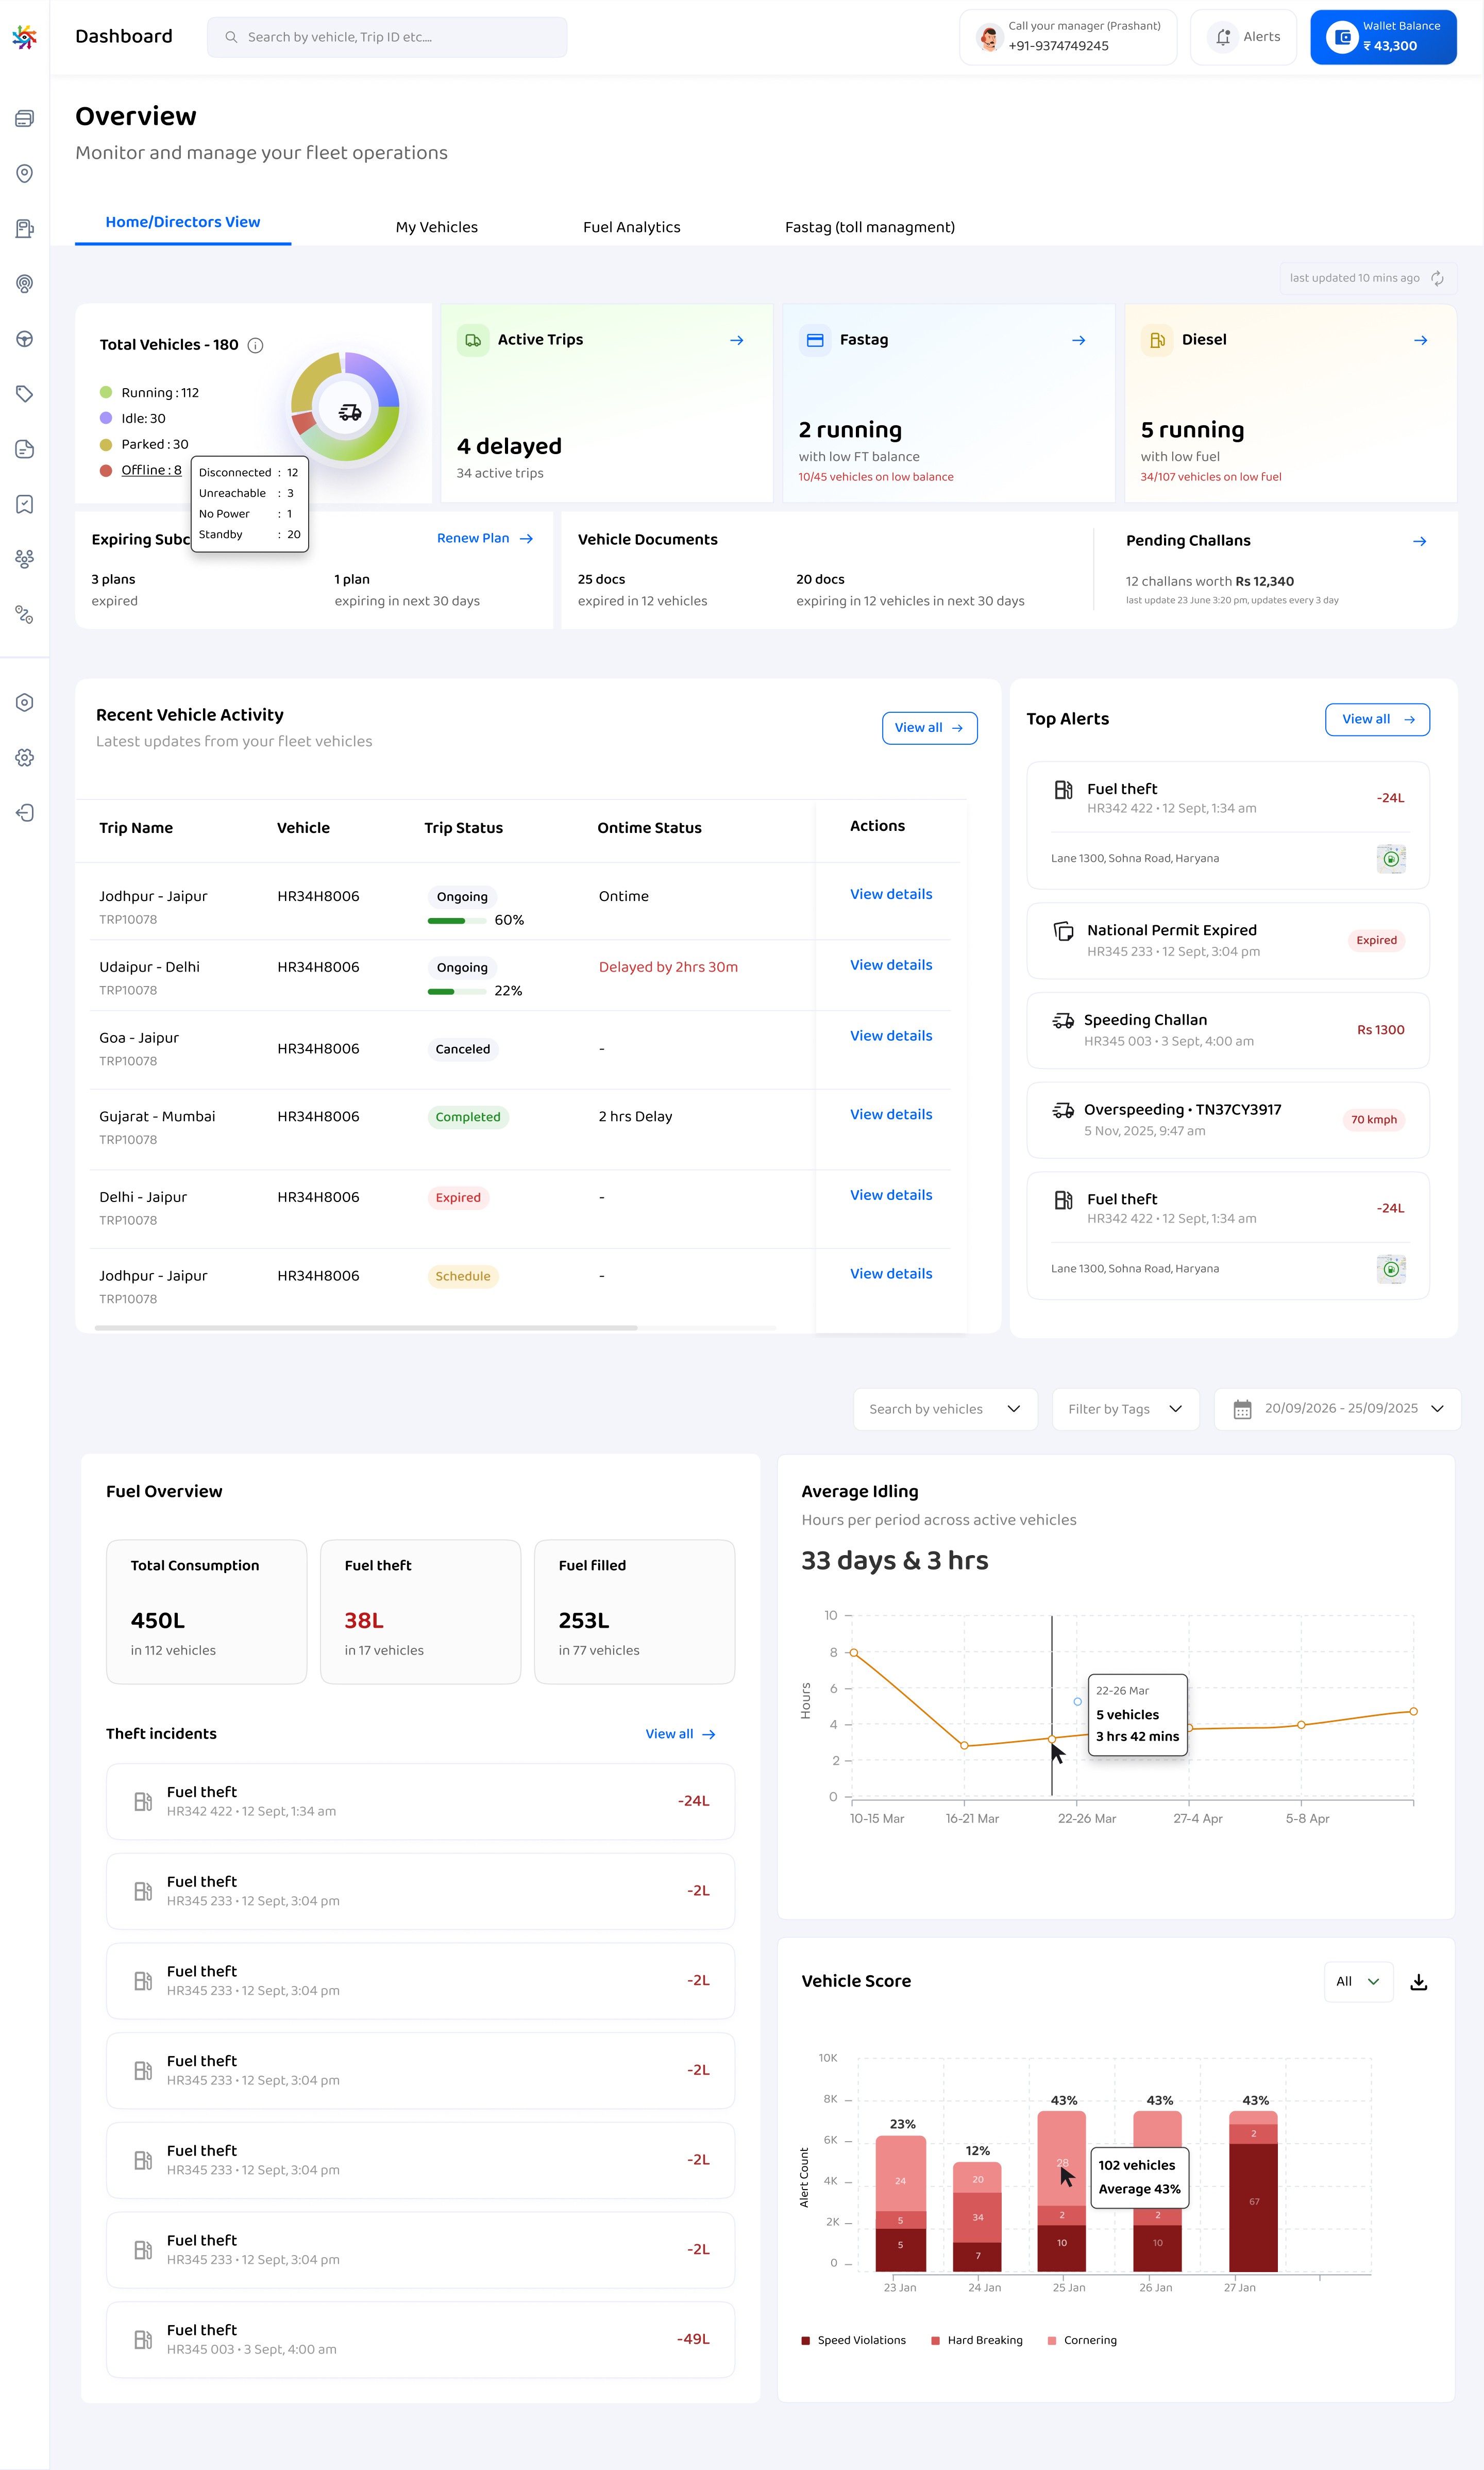
Directors View
Enables fleet owner to assess fleet health in under 10 seconds.
// Built widgets that let users customize the product based on their needs
// Shifts focus from monitoring everything to acting on what matters.
// Decision enabled
WIDGETS

scroll
My Vehicles
Card view of each vehicle and its location on map
// Birdview of every truck in motion and its related details
// User can take quick actions if fuel is less or truck stopped for too long by calling the driver


Trips
Every route, from scheduled to delivered.
// Built for the manager who can't be on the road
// Get full story of a single trip.
// Fuel, tolls, stops: everything in one placea
scroll
Fuel Analytics
Enables fleet owner to assess fuel and its financial health
// Actionable and priority events placed upfront to enable faster decision-making
// Data trust: Sensor health shown first
// Geography as insight Heatmap shows where money is being lost, not just how much


IMPACT & LEARNINGS
Impact & Future Potential
Project in progress, metrics yet to be achieved.
Improved fleet visibility and enabled faster decision-making for large fleet owners.
Created stronger upsell and retention opportunities for Pro and Diesel Sensor products.
Learnings
This project reinforced the importance of designing not just interfaces, but shared understanding across teams.

